NAT policy analysis summary
When analysis completes, select a NAT policy to review the right-pane summary and click View analysis details.
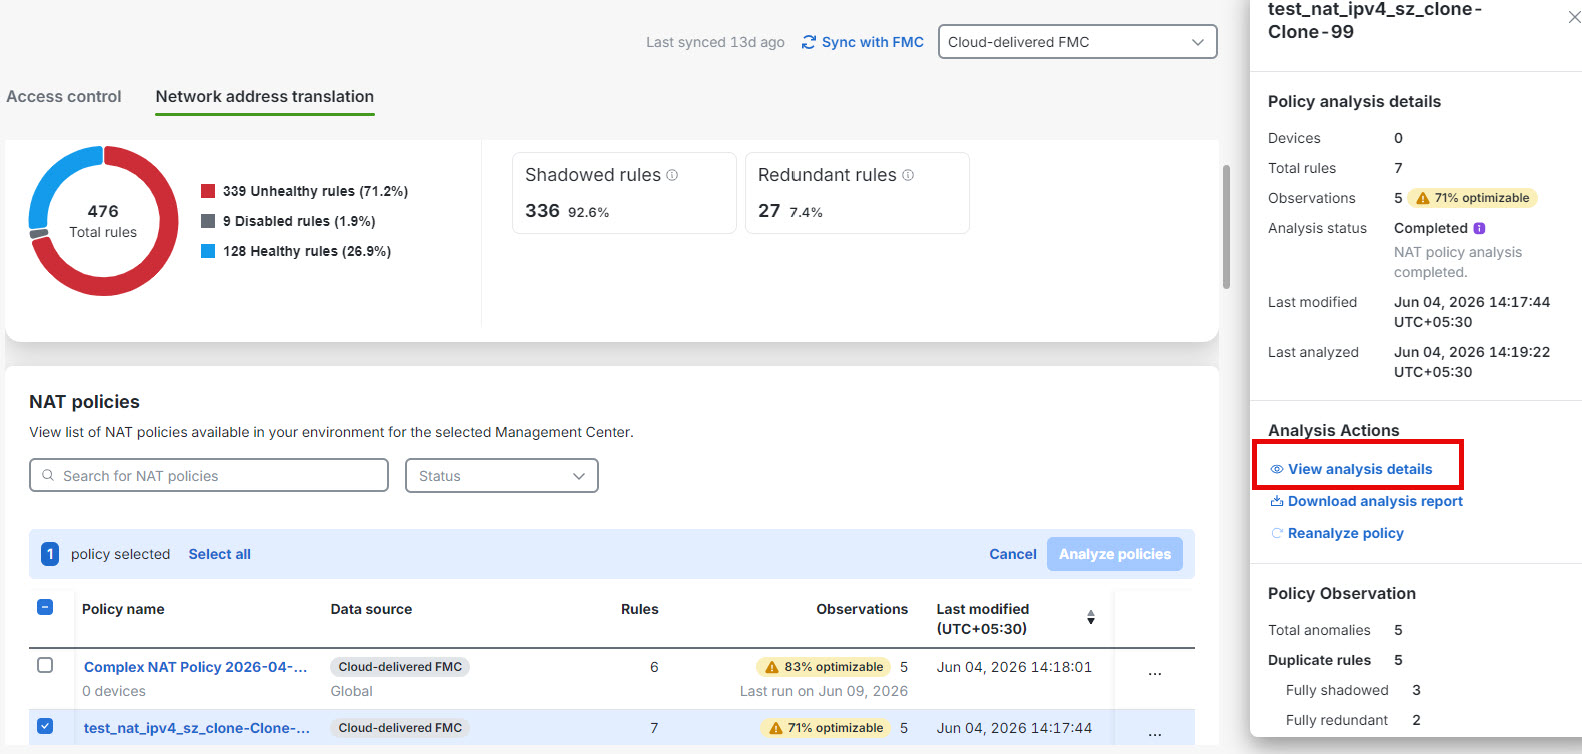
The policy-specific page displaying the anomaly details is shown.
-
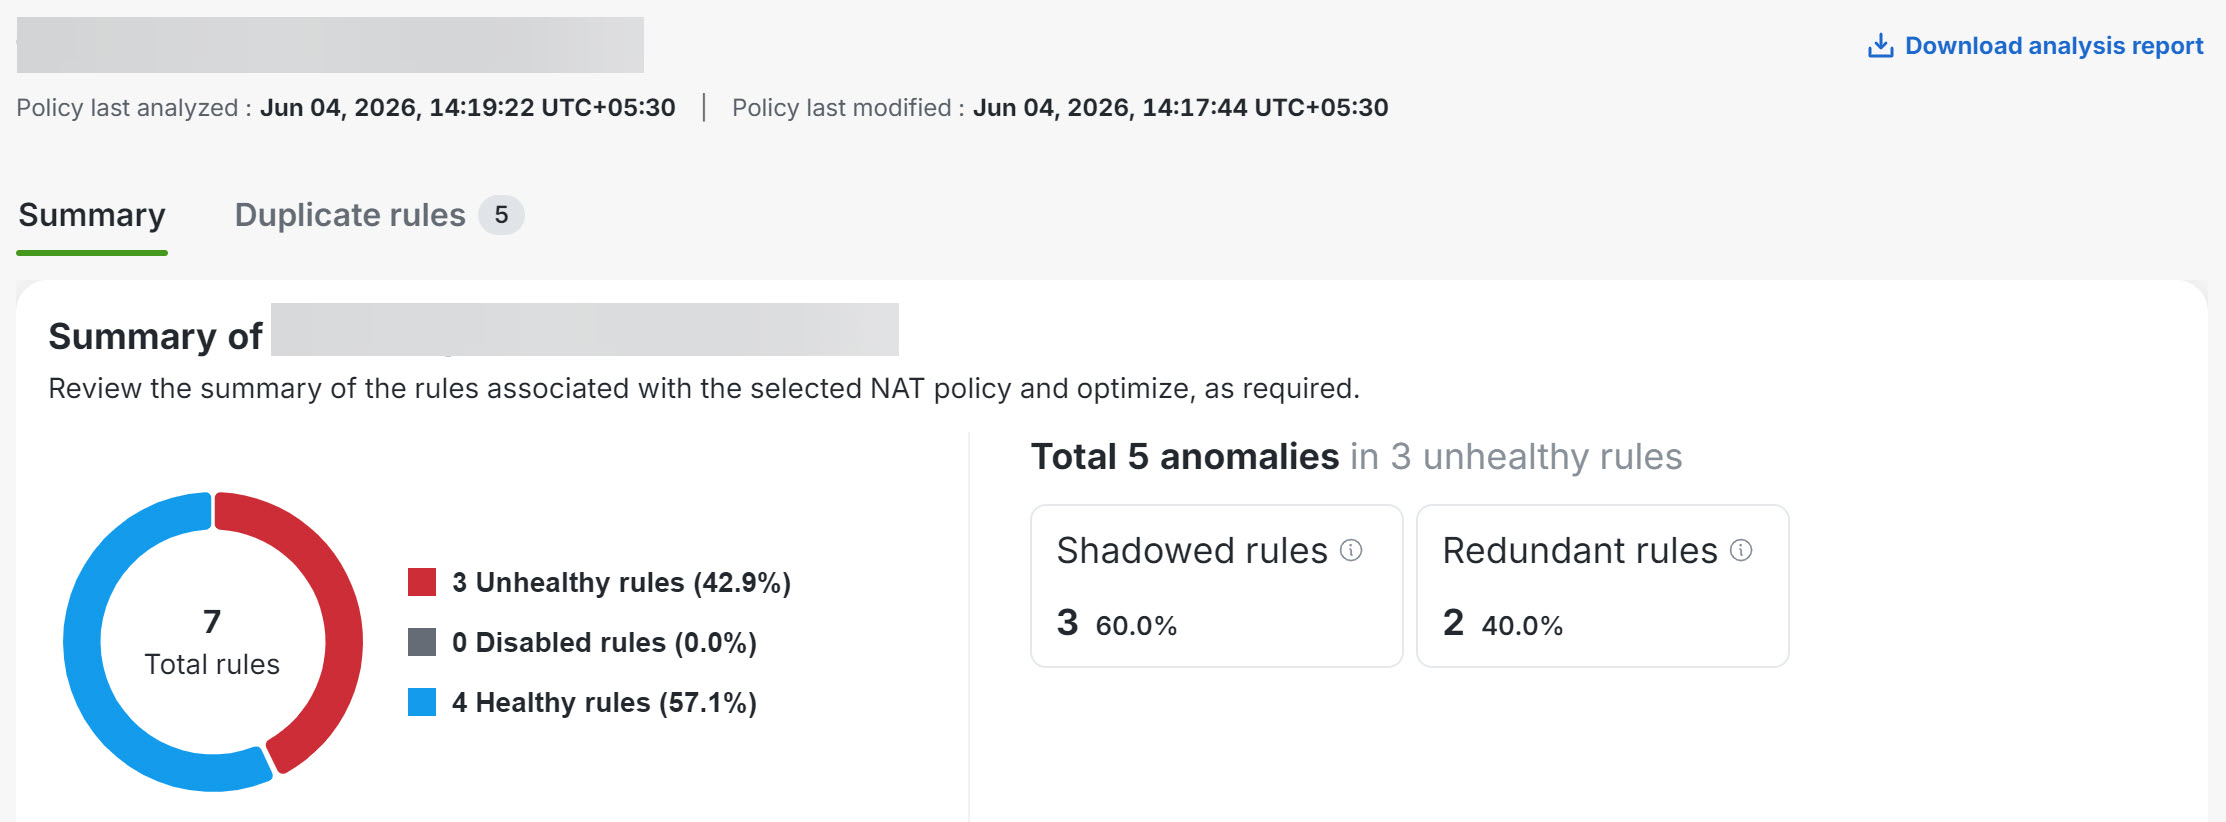
Overall summary—provides insights on how many rules are unhealthy, disabled, healthy, using a pie chart for the selected NAT policy. You can also hover over the part of the pie to view the percentage of rules.
-
Total anomalies—shows the number of rule anomalies detected in the selected NAT policy. Also indicates how many unhealthy rules contain those anomalies.