Health monitoring
Health monitoring is a system capability that
-
tracks various health indicators to ensure hardware and software are working correctly,
-
checks the status of critical functionality across your deployment, and
-
enables configuration of test frequency for alerting and time series data collection.
Health monitoring capabilities
The Cloud-Delivered Firewall Management Center also supports time series data collection. You can configure the frequency of collecting the time series data on the device and its health modules. The device monitor reports these metrics in several predefined health monitor dashboards by default. The metric data is collected for analysis and hence no alerting is associated with it.
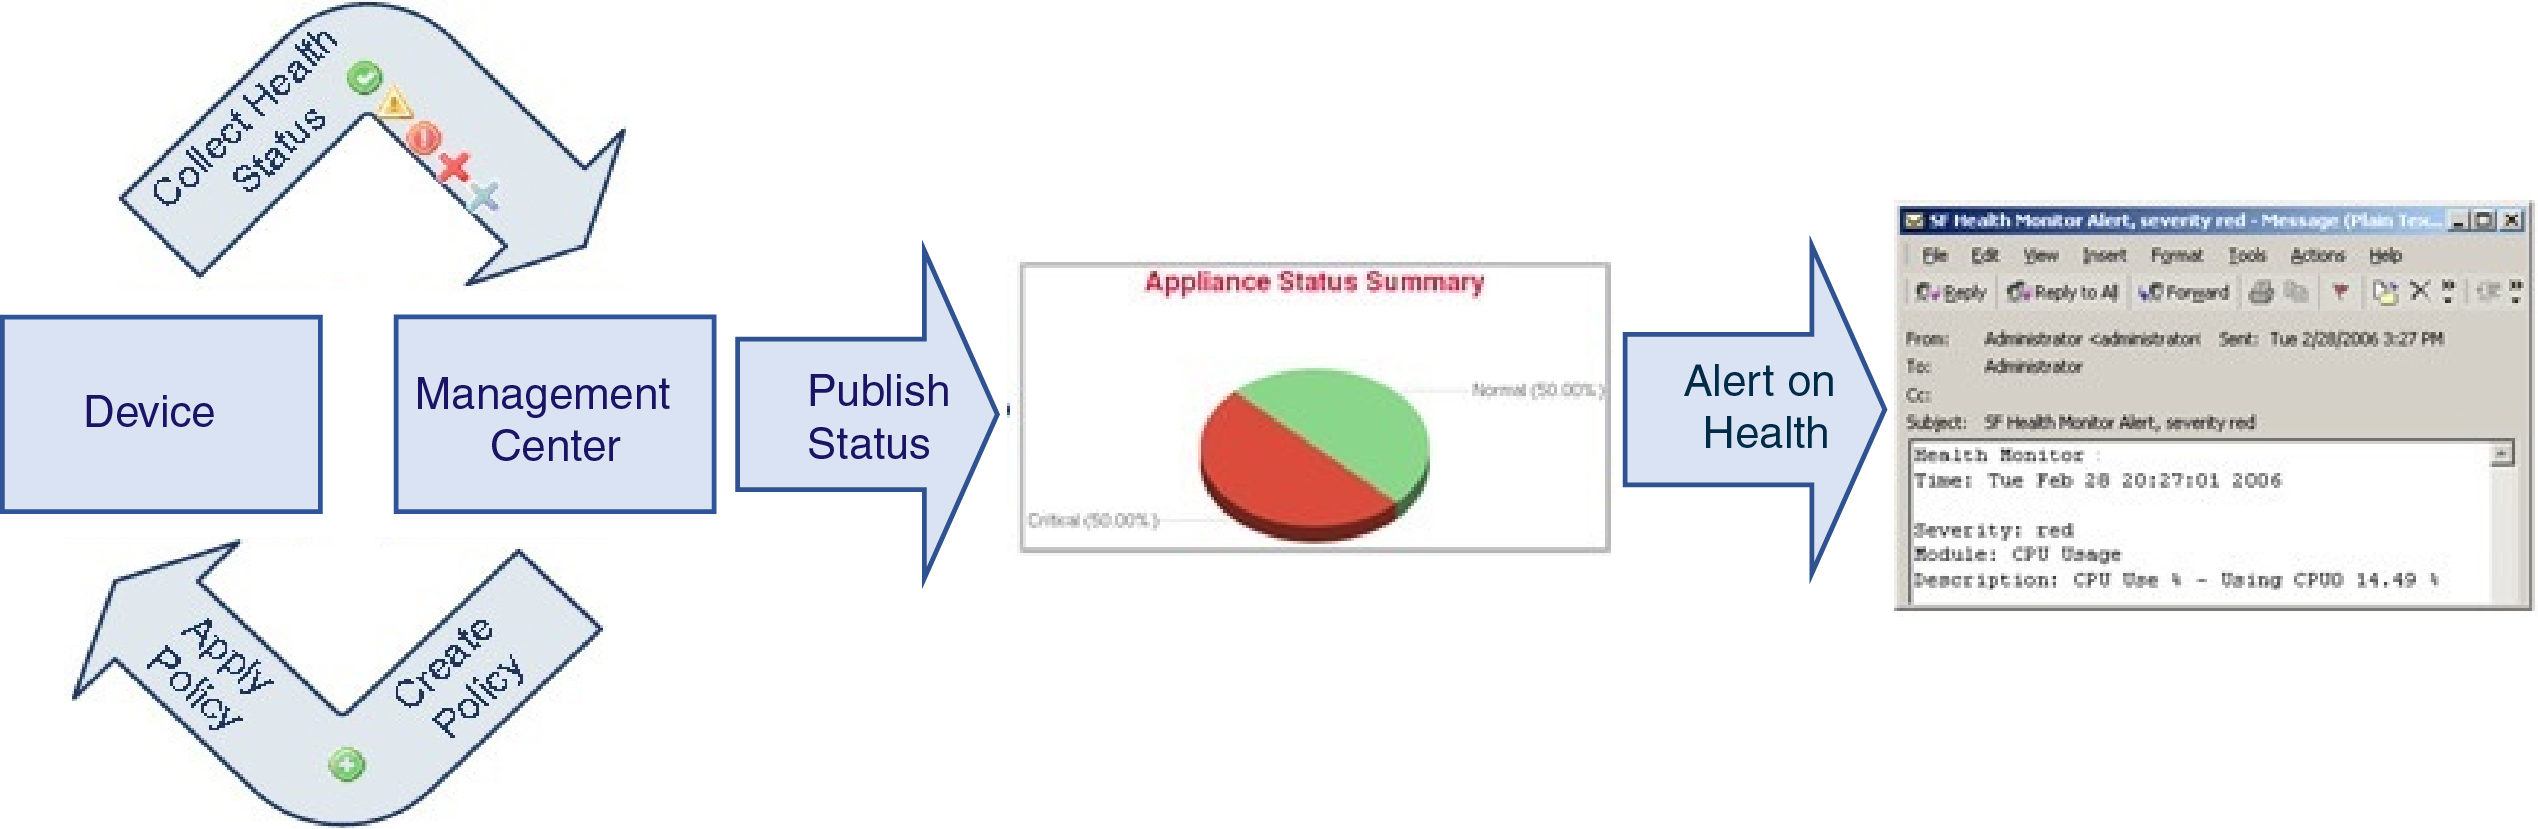
You can use the health monitor to create a collection of tests, referred to as a health policy, and apply the health policy to one or more appliances. The tests, referred to as health modules, are scripts that test for the criteria you specify. You can modify a health policy by enabling or disabling tests or by changing test settings, and you can delete health policies that you no longer need. You can also suppress messages from selected appliances by excluding them.
The health monitoring system run the tests in a health policy at the configured intervals. You can also run all tests, or a specific test, on demand. The health monitor collects health events based on the test conditions configured.
Note | All appliances automatically report their hardware status via the Hardware Alarms health module. The Cloud-Delivered Firewall Management Center also automatically reports status using the modules configured in the default health policy. Some health modules, such as the Appliance Heartbeat module, run on the Cloud-Delivered Firewall Management Center and report the status of the Cloud-Delivered Firewall Management Center's managed devices. For the health modules to provide managed device status, you must deploy all health policies to the device. |
You can use the health monitor to access health status information for the entire system and for a particular appliance. In a multi-domain deployment, you can view the health status summary for a device in the domain where the device is located.
A hexagon-shaped widget and status tables on the Health Status page provide a visual summary of the status of all appliances on your network, including the Cloud-Delivered Firewall Management Center. Individual appliance health monitors let you drill down into health details for a specific appliance.
Fully customizable event views allow you to quickly and easily analyze the health status events gathered by the health monitor. These event views allow you to search and view event data and to access other information that may be related to the events you are investigating. For example, if you want to see all the occurrences of CPU usage with a certain percentage, you can search for the CPU usage module and enter the percentage value.
You can also configure email, SNMP, or syslog alerting in response to health events. A health alert is an association between a standard alert and a health status level. For example, if you want to make sure an appliance never fails due to hardware overload, you can set up an email alert. You can then create a health alert that triggers an email alert whenever CPU, disk, or memory usage reaches the Warning level you configure in the health policy applied to that appliance. You can set alerting thresholds to minimize the number of repeating alerts you receive.
Note | The health monitoring can take 5–6 minutes from the occurrence of the health event to generate the health alert. |
You can also generate troubleshooting files for an appliance if you are asked to do so by Support.
Only users with administrator user role privileges can access system health data.
In a Cloud-Delivered Firewall Management Center high-availability deployment running Version 6.7 or higher, the active Cloud-Delivered Firewall Management Center creates a health monitor page that uses REST APIs to show detailed metric-based information. The standby Cloud-Delivered Firewall Management Center creates the health monitor page that shows the alert information and provide a visual summary of the status of all appliances on your network using pie charts and status tables. The standby Cloud-Delivered Firewall Management Center does not display the metric-based information.