Monitor Site-to-Site VPNs Using Site-to-Site VPN Dashboard
Choose to open the site to site dashboard.
The Cloud-Delivered Firewall Management Center provides a snapshot of the site-to-site VPN tunnels , including SASE topology tunnels, to determine the status of the site-to-site VPN tunnels. You can view the list of tunnels between peer devices and the status of each tunnel: Active, Inactive, or No Active Data. You can filter the data in the table according to the topology, device, and status. The table in the monitoring dashboard presents live data and you can configure to refresh the data at a specified interval. The table shows the peer-to-peer, hub and spoke, and full mesh topologies for crypto map-based VPNs. The tunnel information also contains the data for the route-based VPNs or Virtual Tunnel Interfaces (VTIs).
You can use this data to:
-
Identify problematic VPN tunnels and troubleshoot.
-
Verify connectivity between the site to site VPN peers devices.
-
Monitor the health of the VPN tunnels to provide uninterrupted VPN connectivity between sites.
The site-to-site VPN dashboard displays the following widgets for the site-to-site VPN tunnels:
-
Tunnel Status—A table listing the tunnel status of the site-to-site VPNs , including the SASE tunnels for Umbrella, configured using the Cloud-Delivered Firewall Management Center
-
Tunnel Summary—Aggregated status of the tunnels in a donut graph.
-
Topology—Status of tunnels summarized by topology.
Guidelines and Limitations
-
The table shows the list of site-to-site , including SASE topology, VPNs that are deployed. It does not show the tunnels that are created and not deployed.
-
The table does not show the information about the backup tunnels of policy-based VPNs and backup VTIs.
-
For cluster deployments, the table does not show director change in real-time data. It shows only the director information that existed when the VPN was deployed. The director change reflects in the table only after the tunnel AM redeployed after the change.
Status of VPN Tunnels
The site-to-site monitoring dashboard lists the VPN tunnels in the following states:
-
Inactive—A policy-based (crypto map-based) VPN tunnel is inactive if all the IPSec tunnels are down. A VTI or and SASE topology VPN tunnel is down if the tunnel encounters any configuration or connectivity issues.
-
Active—In the Cloud-Delivered Firewall Management Center, policy-based site-to-site VPNs are configured based on IKE policies and IPsec proposals that are assigned to VPN topologies. A policy-based VPN tunnel is in the Active state if the Cloud-Delivered Firewall Management Center identifies interesting traffic through the tunnel after the deployment. An IKE tunnel is up only if a minimum of one IPsec tunnel is up.
Route-based VPN (VTI) and SASE topology VPN tunnels do not require interesting traffic to be in the Active state. They are in the Active state if they are configured and deployed without errors.
-
No Active Data—Policy-based and SASE topology VPN tunnels remain in the No Active Data state until there is a traffic flow event through the tunnel for the first time. The No Active Data state also lists the policy-based and route-based VPNs that have been deployed with errors.
Important Notes About Tunnel Statuses in the Cloud-Delivered Firewall Management Center
-
The VPN statuses in the Cloud-Delivered Firewall Management Center are event-based. The Cloud-Delivered Firewall Management Center does not initiate status updates. Hence, there might be mismatches between the tunnel statuses in the dashboard and the Firewall Threat Defense. You can view the correct status in the CLI Details tab of the Tunnel Status widget.
-
When a Firewall Threat Defense switches over to a secondary Firewall Threat Defense, there is a mismatch between the status of the VPN tunnels in the Cloud-Delivered Firewall Management Center and the Firewall Threat Defense. When the device switches back to the primary device, the correct tunnel status appears.
-
The Cloud-Delivered Firewall Management Center does not update the tunnel status of Firewall Threat Defense devices earlier than 7.3 after the devices reboot. We recommend that you bring the tunnel down using the command vpn-sessiondb logoff index and bring it up using the packet tracer.
Tunnel Status
This table lists the site-to-site VPNs, including SASE topology VPN, configured using the Cloud-Delivered
Firewall Management Center. Hover over a topology and click View ( ) to view the following details about the topology:
-
General—Displays more information about the nodes such as IP address and interface name.
-
CLI Details—Displays the CLI outputs for the following commands:
-
show crypto ipsec sa peer <node A/B_ip_address>: Displays the IPsec SAs built between Node A and B.
-
show vpn-sessiondb l2l filter ipaddress <node A/B_ip_address>: Displays information about VPN sessions.
For an extranet device, no command output appears.
Important details about the IKE and IPsec sessions, derived from the above command outputs, appear in a summarized, and user-friendly format. You can view the details of both nodes at a time. The icon next to the node name specifies the authentication type: preshared key or client certificate. The details include IKE statistics per tunnel and IPsec SA statistics as shown below:
Tunnel Status > View > CLI Details 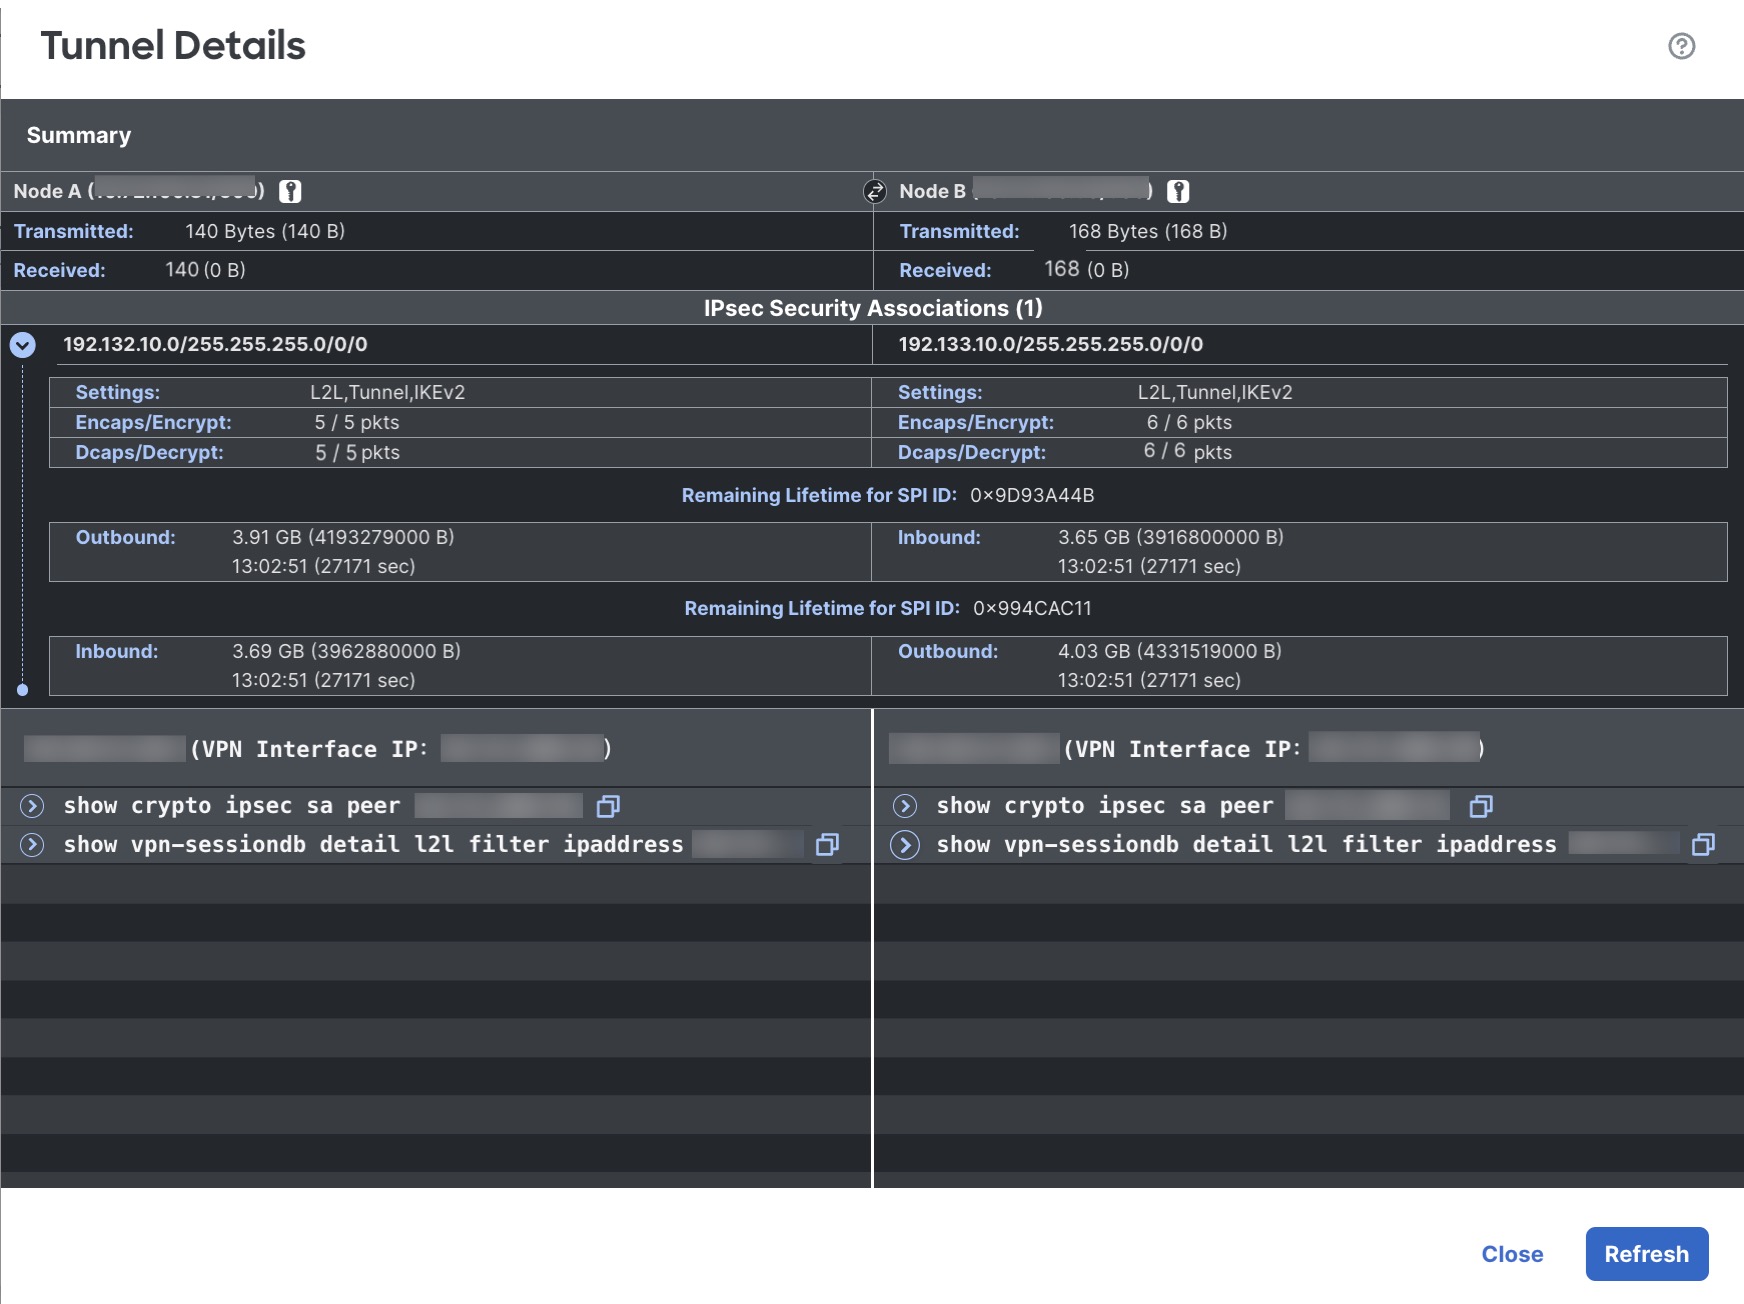
-
-
Packet Tracer—Use packet tracer to troubleshoot the threat defense VPN tunnels.
Packet Tracer
Packet tracer allows you to troubleshoot VPN tunnels between two threat defense devices. You can check if the VPN connection between device A and device B is up. This tool injects a packet into the device and tracks the packet flow from the ingress to the egress ports. The tool simulates traffic after you configure the ingress interfaces of the devices along with the protected networks. Packet tracer evaluates the packet against modules such as flow and route lookups, ACLs, protocol inspection, NAT, and QoS.
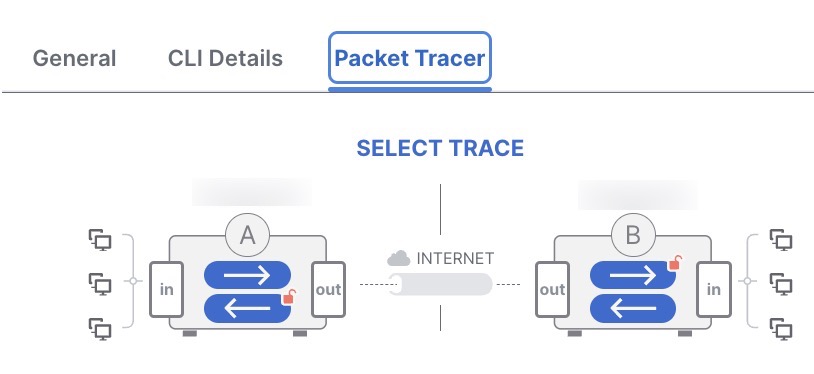
For each device, the tool runs an encrypted trace and a decrypted trace (packet is treated as decrypted VPN traffic). You can run four different traces between the ingress and egress ports of the devices. Click the individual encrypt and decrypt options to enable or disable the trace.
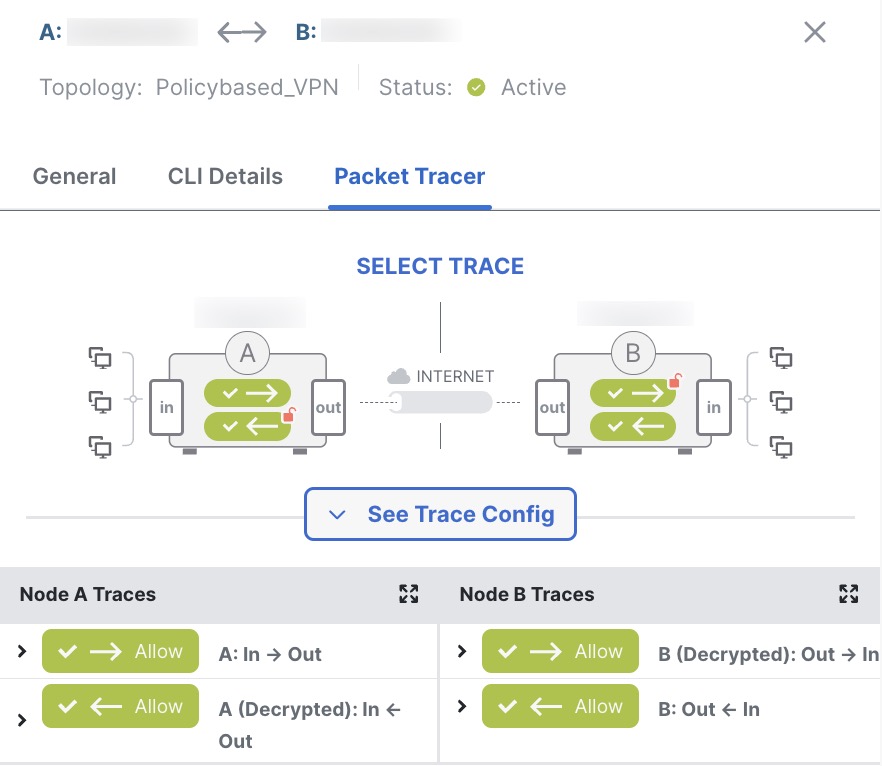
When you run the trace, the tool executes the trace sequentially in the following order:
-
Encrypted trace of A.
-
Decrypted trace of B.
-
Encrypted trace of B.
-
Decrypted trace of A.
After the trace completes, you can view the output of the trace with the results of each module.
Note | You cannot run a decrypt trace for route-based (VTI-based) VPNs. |
To run the Packet Tracer:
-
Click See Detailed Config to view the VPN interface name, VPN interface IP address, VTI interface name, and the VTI Interface IP address.
-
(Optional) Choose a protocol from the Protocol drop-down list. You can choose ICMP/8/0, TCP, or UDP.
ICMP/8/0 is the default option. If you choose ICMP/8/0, 8 indicates the ICMP type as Echo Request and 0 indicates the ICMP code. If you choose TCP or UDP, choose the destination port from the Destination Port drop-down list. The range is from 0 to 65535.
-
Choose the ingress interface for both the devices on which to trace the packet from the Ingress Interface drop-down lists.
-
Enter an IP address from the same subnet as the ingress interface in the Protected Network IP Address fields.
-
Click Trace Now.
After you initiate the trace, you can view if the trace is successful or not for each module. If the tunnel is down, the path appears in red. If the tunnel is up, the path appears in green. If a tunnel is down, click Re-trace to run the tool again. For a crypto-map based VPN, when the tunnel is inactive with no interesting traffic, the initial trace can be red. Click Re-trace to run the trace again.
Extranet Nodes: You can initiate a packet trace for VPN tunnels with one node as an extranet. For an extranet node, you cannot choose the ingress interface. The remaining steps for the packet trace are the same. You can’t run trace on the extranet side.
For example, if Node A is a managed threat defense and Node B is an extranet:
-
Configure the ingress interface for node A.
-
Configure the protected network for Node A and B.
-
Click Trace Now. The traces appear for Node A and not for Node B.
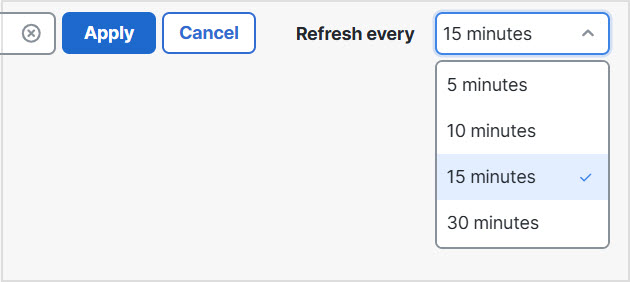
Automatic Data Refresh
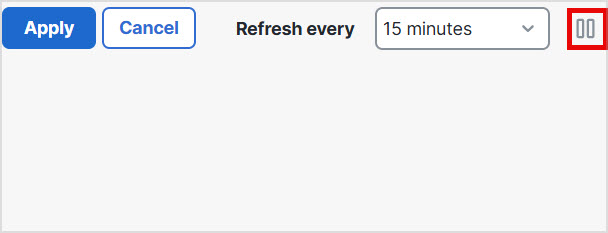
The site to site VPN data in the table refreshes periodically. You can configure the refresh interval of the VPN monitoring data at a specific interval or turn the automatic data refresh off.
Click the Refresh interval drop-down to select from the available intervals to refresh the data in the table.
Click Pause to stop the automatic data refresh for as long as you want. You can click the same button to resume refreshing the tunnel data.
Filter and Sort the Site to Site VPN Monitoring Data
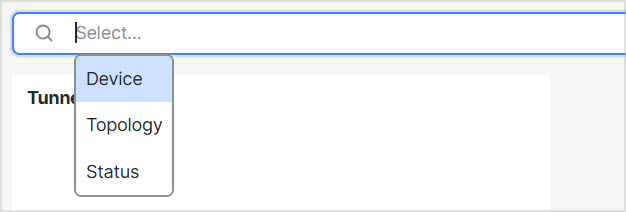
You can filter and view the data in the VPN monitoring table by topology, device, and status.
For example, you can view the tunnels that are in the Down state in a specific topology.
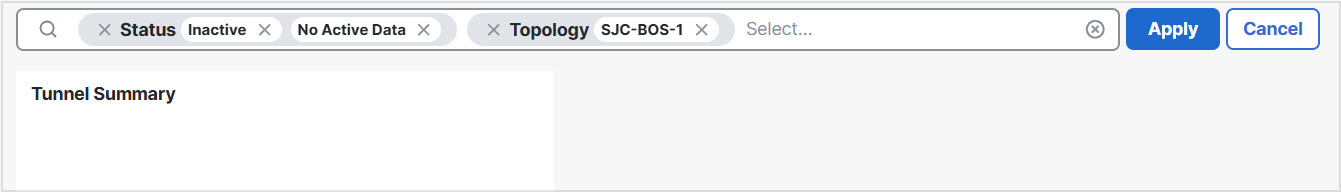
Click within the filter box to choose the filter criteria and then specify the values to filter.
You can use multiple filtering criteria to view the data based on your requirement.
For example, you can choose to view only the tunnels that are in the Up and Down states, and ignore the ones in the Unknown state.
Sort the data—To sort the data by a column, click the column heading.