Tunnel status widget
Features of the widget
Hover over a topology and click View ( ) to view these details about the topology:
-
General—Displays more information about the nodes such as IP address and interface name.
-
CLI Details—Displays the CLI outputs for the following commands:
-
show crypto ipsec sa peer: Displays the IPsec SAs built between Node A and B.
-
show vpn-sessiondb l2l filter ipaddress : Displays information about VPN sessions.
For an extranet device, no command output appears.
Important details about the IKE and IPsec sessions, derived from the above command outputs, appear in a summarized, and user-friendly format. You can view the details of both nodes at a time. The icon next to the node name specifies the authentication type: preshared key or client certificate. The details include IKE statistics per tunnel and IPsec SA statistics as shown below:
Tunnel Status > View > CLI Details 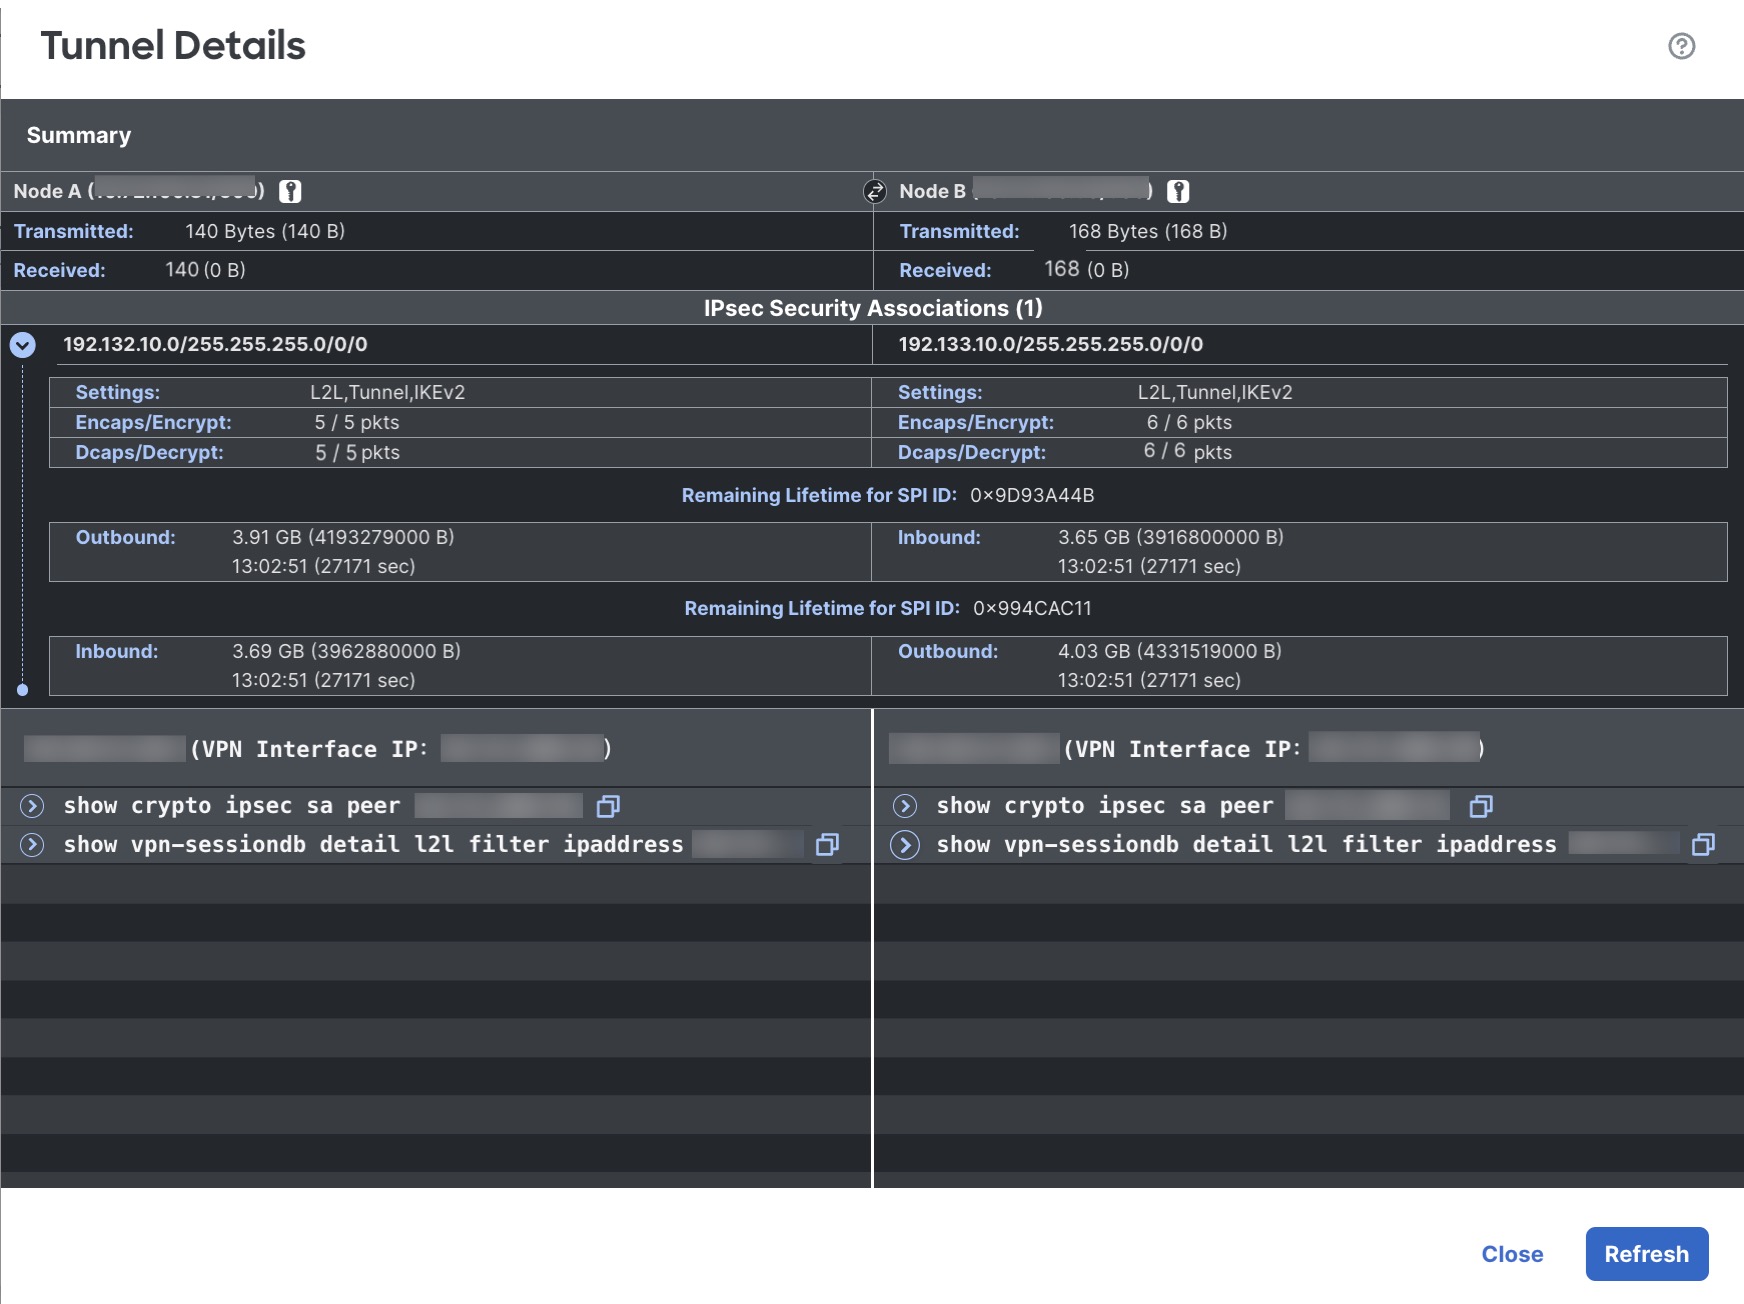
-
-
Packet Tracer—Use packet tracer to troubleshoot the VPN tunnels.
Packet Tracer
Packet tracer allows you to troubleshoot VPN tunnels between two threat defense devices. You can check if the VPN connection between device A and device B is up. This tool performs these actions:
-
Injects a packet into the device and tracks the packet flow from the ingress to the egress ports.
-
Simulates traffic after you configure the ingress interfaces of the devices along with the protected networks.
-
Evaluates the packet against modules such as flow and route lookups, ACLs, protocol inspection, NAT, and QoS.
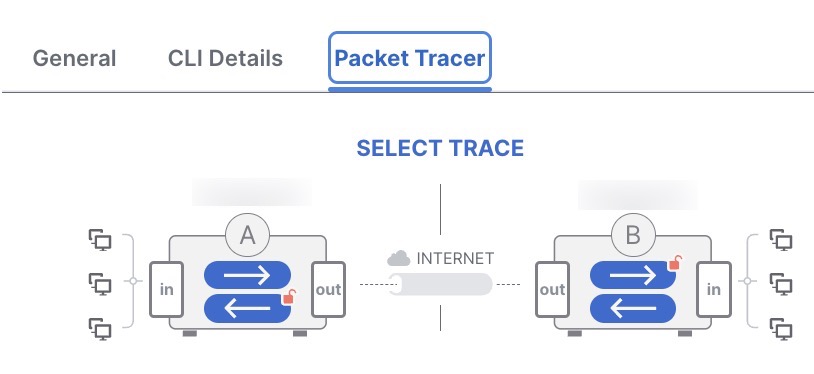
For each device, the tool runs an encrypted trace and a decrypted trace (packet is treated as decrypted VPN traffic). You can run four different traces between the ingress and egress ports of the devices. Click the individual encrypt and decrypt options to enable or disable the trace.
When you run the trace, the tool executes the trace sequentially in the following order:
-
Encrypted trace of A.
-
Decrypted trace of B.
-
Encrypted trace of B.
-
Decrypted trace of A.
After the trace completes, you can view the output of the trace with the results of each module.
Note | You cannot run a decrypt trace for route-based (VTI-based) VPNs. |
To run the Packet Tracer:
-
Click See Detailed Config to view the VPN interface name, VPN interface IP address, VTI interface name, and the VTI Interface IP address.
-
(Optional) Choose a protocol from the Protocol drop-down list. You can choose ICMP/8/0, TCP, or UDP.
ICMP/8/0 is the default option. If you choose ICMP/8/0, 8 indicates the ICMP type as Echo Request and 0 indicates the ICMP code. If you choose TCP or UDP, choose the destination port from the Destination Port drop-down list. The range is from 0 to 65535.
-
Choose the ingress interface for both the devices on which to trace the packet from the Ingress Interface drop-down lists.
-
Enter an IP address from the same subnet as the ingress interface in the Protected Network IP Address fields.
-
Click Trace Now.
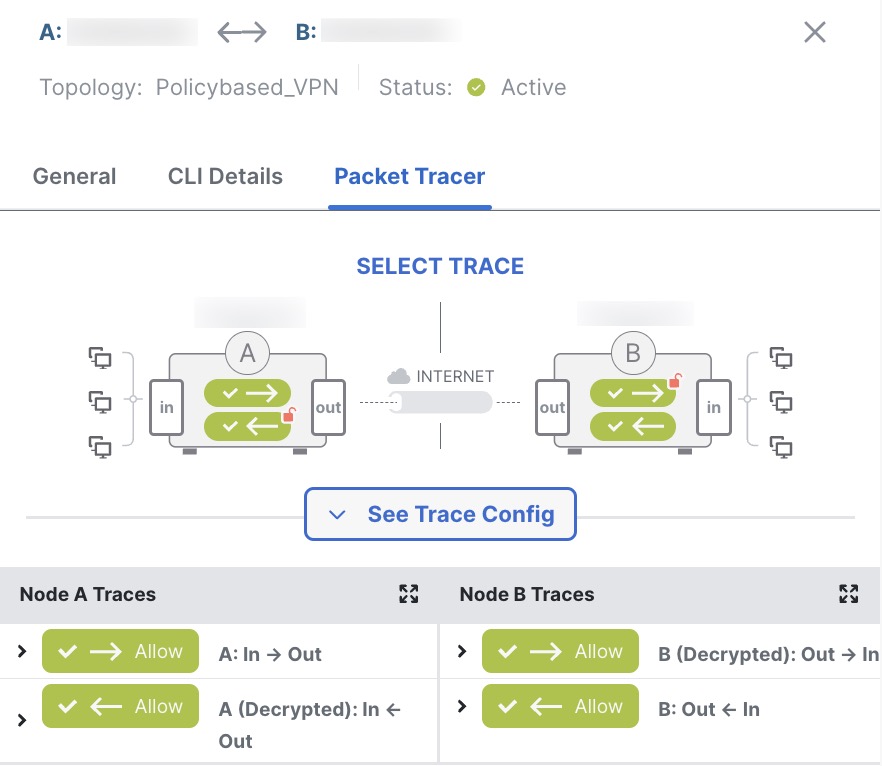
After you initiate the trace, you can view if the trace is successful or not for each module. If the tunnel is down, the path appears in red. If the tunnel is up, the path appears in green. If a tunnel is down, click Re-trace to run the tool again. For a crypto-map based VPN, when the tunnel is inactive with no interesting traffic, the initial trace can be red. Click Re-trace to run the trace again.
Extranet Nodes: You can initiate a packet trace for VPN tunnels with one node as an extranet. For an extranet node, you cannot choose the ingress interface. The remaining steps for the packet trace are the same. You can’t run trace on the extranet side.
For example, if Node A is a managed threat defense and Node B is an extranet:
-
Configure the ingress interface for node A.
-
Configure the protected network for Node A and B.
-
Click Trace Now. The traces appear for Node A and not for Node B.