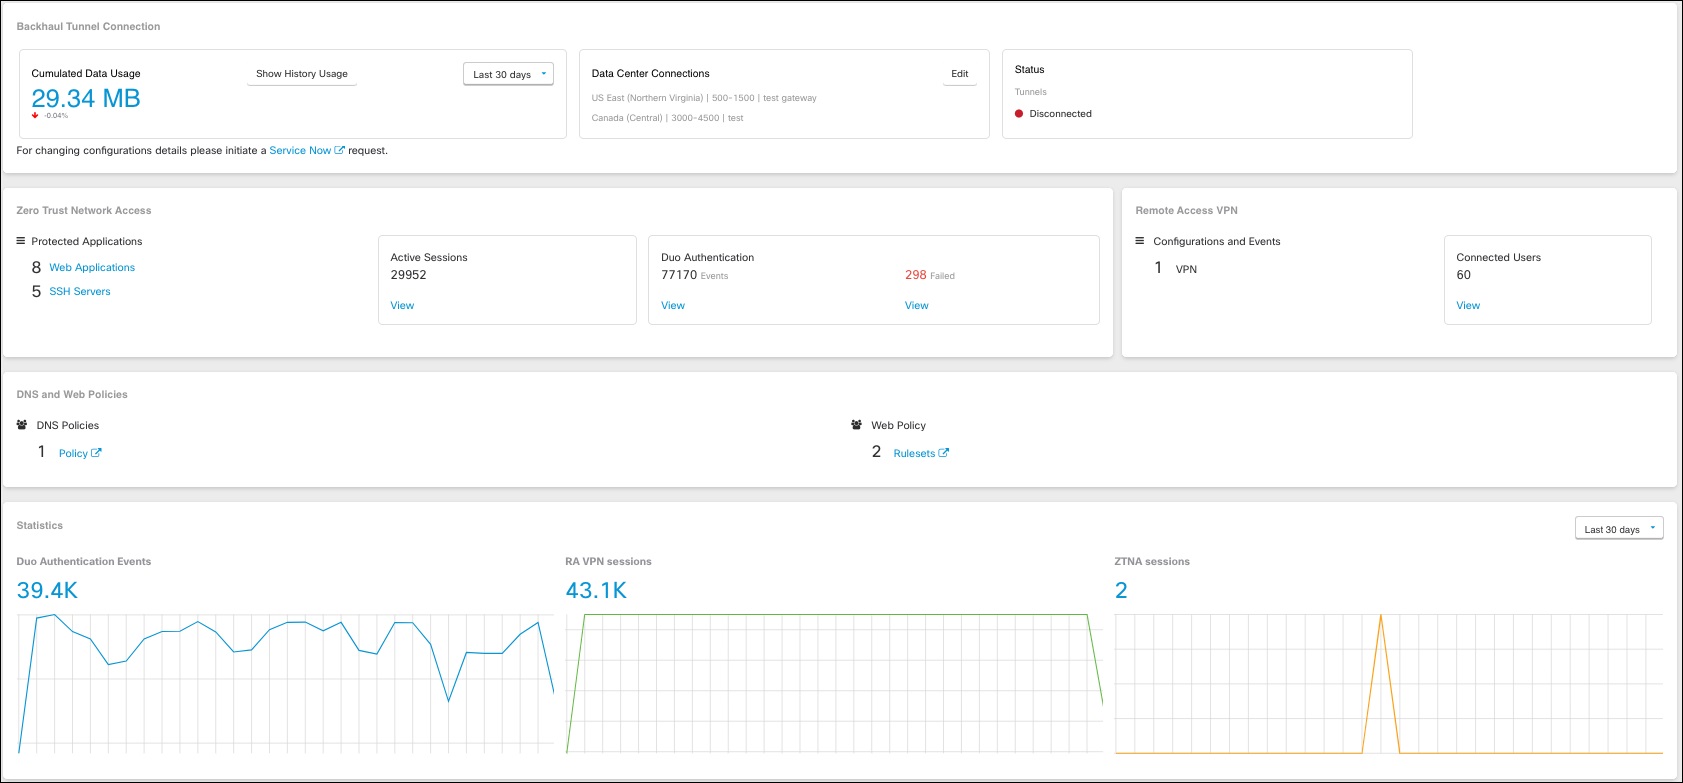
Secure Connect Choice Overview Dashboard
The Secure Connect Choice Overview dashboard displays at-a-glance information retrieved from all systems that are integrated with the Cisco+ Secure Connect Choice offering. The dashboard summarizes the protected applications, user sessions, policies, and statistics associated with each system. In addition, the dashboard provides links to visualize the detailed information.
View the Secure Connect Choice Dashboard
To view the Secure Connect Choice Overview dashboard:
-
Log in to your CDO tenant.
-
In the CDO navigation bar, click .
You can monitor these aspects of the Secure Connect Choice solution:

Backhaul Tunnel Connection: Displays the backhaul statistics widget that provides transit gateway traffic, data center details, and connectivity status.
-
The Cumulated Data Usage shows the total amount of data transmitted in all the tunnels between the gateway and customer network. This field shows historical data, and you can view the data accumulated for the last 24 hours, 7 days, or 30 days.
The Show history data usage shows the monthly data usage from all the tunnels connected to the gateway. It displays the total data used versus the usage limit allowed. The data usage is shown for the last 12 months.
-
The Data Center Connections shows the data center location and the number of VPN users supported. You can click Edit to modify the details or add another connection. Click the gateway link to view the detailed gateway information.
The Status shows the connectivity state of the tunnel.
-
Shows Partially Connected when some of the tunnels are not connected and the rest are connected to the customer gateway.
-
Shows Disconnected when none of the tunnels are connected to the customer gateway.
-
Shows Connected when tunnels are connected to the customer gateway.
-
Zero Trust Network Access:
-
Configuration: Displays the total number of internal protected web applications, SSH servers your users are currently accessing, and the number of regions configured. The Region displays the number of Secure Connect Choice clusters configured in your tenant.
-
Active Sessions: Displays the total number of active ZTNA sessions. Click View to view all active ZTNA sessions.
-
Duo Authentication
-
Displays the total number of authentication requests from users connecting to the Duo. Click View to view the authentication requests that were granted.
-
Displays the total number of authentication requests that failed. Click View to view all authentication requests that were denied.
-
-
Remote Access VPN:
-
Configuration and Events: Displays the total number of remote access VPN configurations configured on the VPN head-ends in your tenant.
-
Connected Users: Displays the total number of active VPN user sessions on the head-ends. Click View to view all active user sessions.
-
DNS and Web Policies: Displays the total number of DNS and Web policies retrieved from the Umbrella organization. These policies are used to protect your remote users connecting to external sites that don’t require VPN connectivity.
Note | You must sign in to the Umbrella Organization page to view the following policies:
|
Statistics: Represents events and sessions data on a line graph for a period that can be filtered by time: the last 24 hours, the last seven days, and the last thirty days.