Monitoring clustering: private cloud
You can monitor the cluster in the Cloud-Delivered Firewall Management Center and at the Firewall Threat Defense CLI.
-
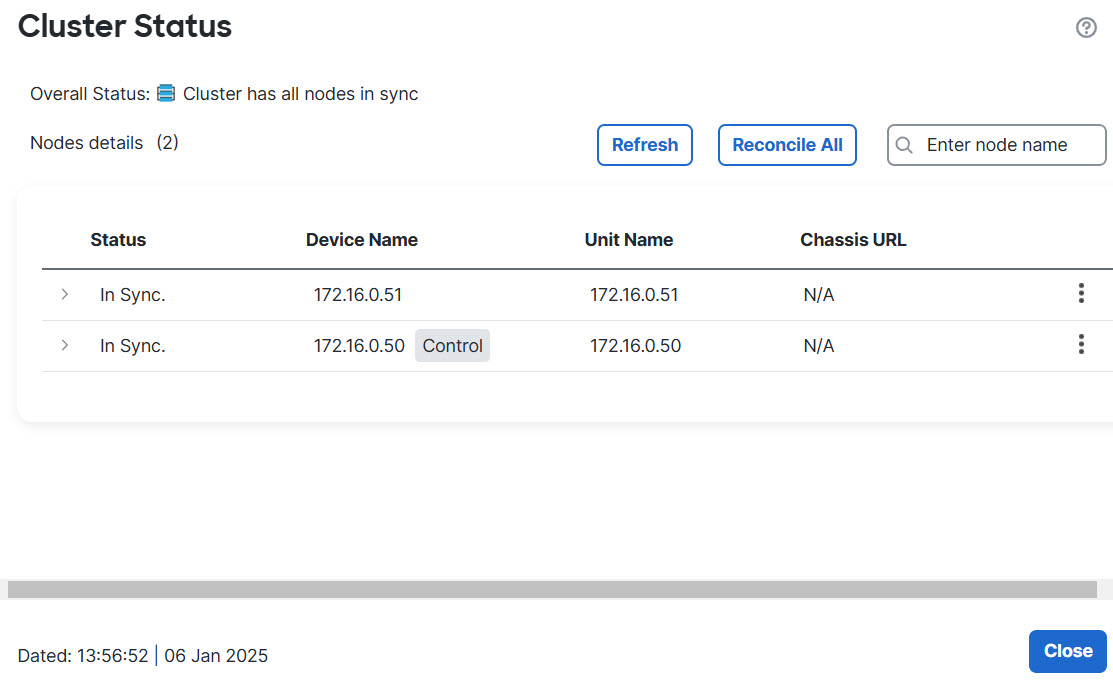
Cluster Status dialog box, which is available from the , More (
 ) icon or from the , click Add, choose the Cluster page General area Cluster Live Status link.
Cluster Status 
The Control node has a graphic indicator identifying its role.
Cluster member Status includes the following states:
-
In Sync.—The node is registered with the Cloud-Delivered Firewall Management Center.
-
Pending Registration—The node is part of the cluster, but has not yet registered with the Cloud-Delivered Firewall Management Center. If a node fails to register, you can retry registration by clicking Reconcile All.
-
Clustering is disabled—The node is registered with the Cloud-Delivered Firewall Management Center, but is an inactive member of the cluster. The clustering configuration remains intact if you intend to later re-enable it, or you can delete the node from the cluster.
-
Joining cluster...—The node is joining the cluster on the chassis, but has not completed joining. After it joins, it will register with the Cloud-Delivered Firewall Management Center.
For each node, you can view the Summary or the History.
Node Summary 
Node History 
-
-
System (
 ) > Tasks page.
The Tasks page shows updates of the Cluster Registration task as each node registers.
-
and then click cluster_name.
When you expand the cluster on the devices listing page, you can see all member nodes, including the control node shown with its role next to the IP address. For nodes that are still registering, you can see the loading icon.
-
show cluster {access-list [acl_name] | conn [count] | cpu [usage] | history | interface-mode | memory | resource usage | service-policy | traffic | xlate count}
To view aggregated data for the entire cluster or other information, use the show cluster command.
-
show cluster info [auto-join | clients | conn-distribution | flow-mobility counters | goid [options] | health | incompatible-config | loadbalance | old-members | packet-distribution | trace [options] | transport { asp | cp}]
To view cluster information, use the show cluster info command.