View deployment history to track and analyze past deployment activities, including successful deployments, failed deployments, and rollback operations.
In the deployment history, the last 10 successful deployments, the last 5 failed deployments, and last 5 rollback deployments are captured.
Procedure
Step 1
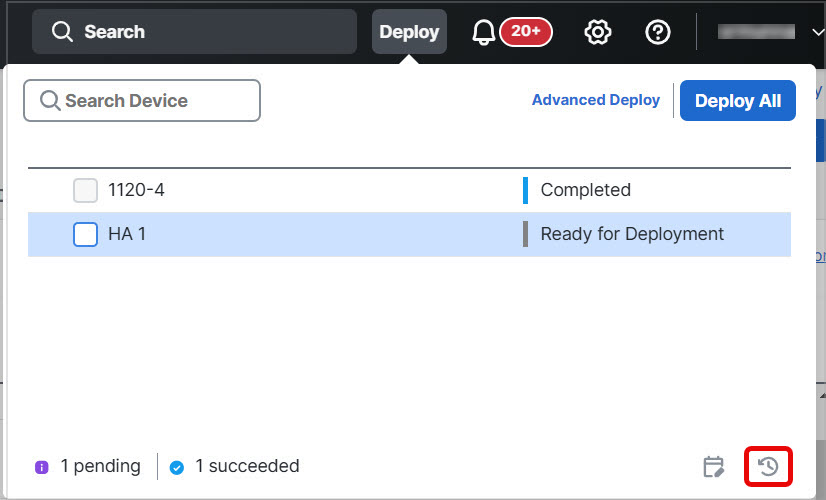
On the Cloud-Delivered
Firewall Management Center menu bar, click Deploy and then click Deployment History ().
Deployment history icon
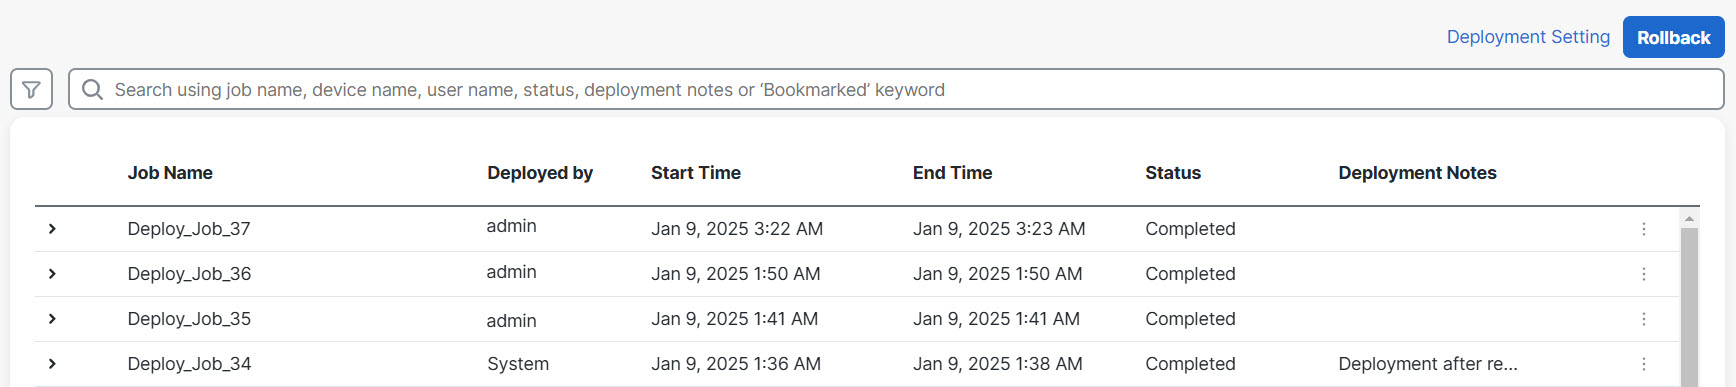
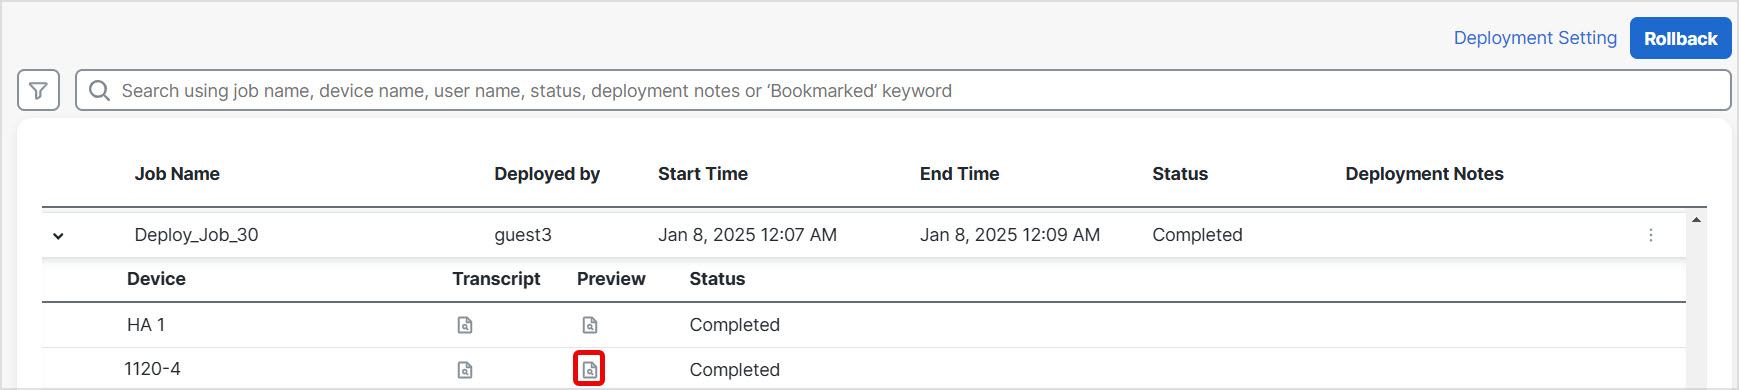
A list of all the previous deployment and rollback jobs is displayed in reverse chronological order.
Deployment history page
Step 2
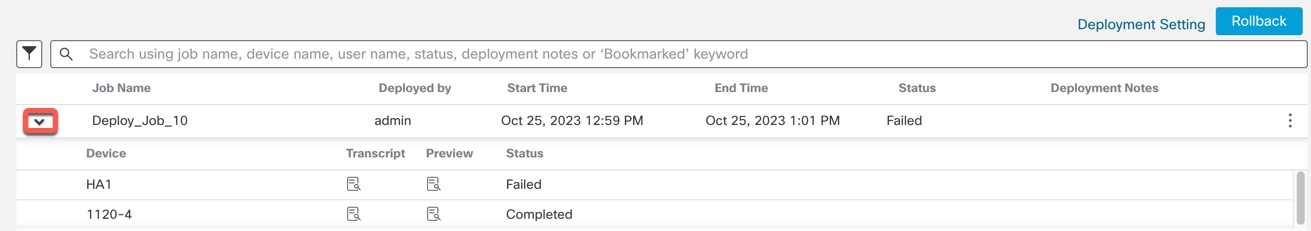
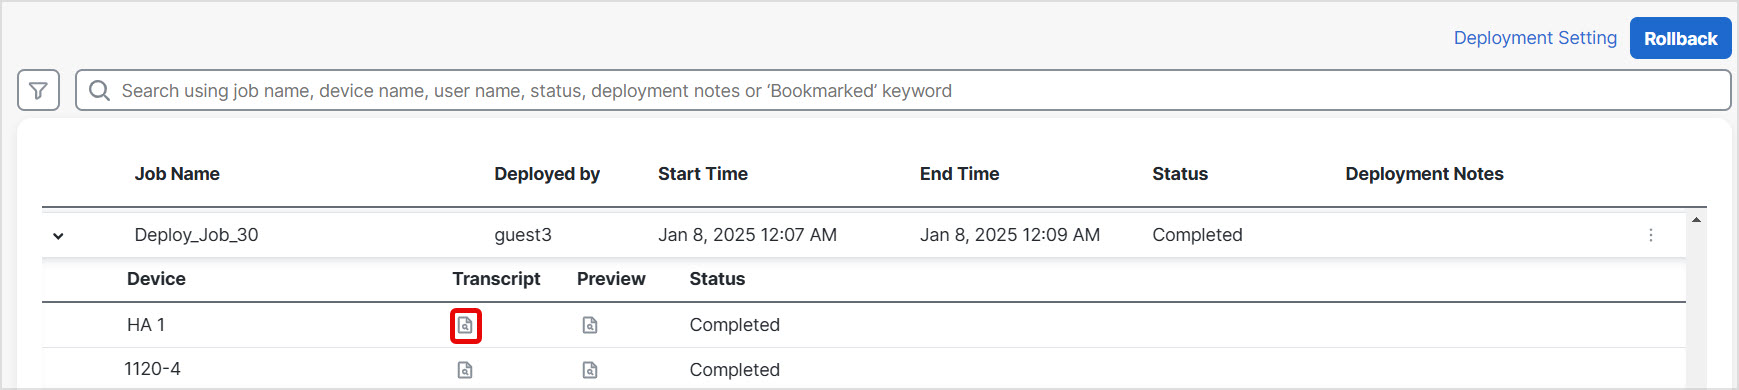
Click Expand Arrow () next to the required deployment job to view the devices included in the job and their deployment statuses.
Expand
View notes in the Deployment Notes column.
Deployment notes are custom notes that a user can add as part of the deployment, and these notes are optional.
Step 3
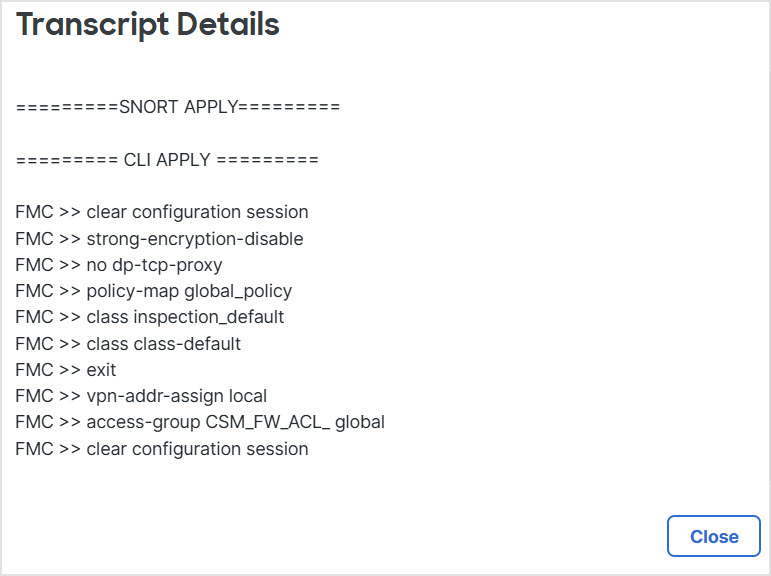
(Optional) Click Transcript Details () to view the commands sent to the device, and the responses received.
Transcript details iconTranscript details
The transcript includes the following sections:
Snort Apply—If there are any failures or responses from Snort-related policies, then the messages are displayed in this section. Normally, the section is empty.
CLI Apply—This section covers features that are configured using commands that are sent to the device.
Infrastructure Messages—This section shows the status of different deployment modules.
In the CLI Apply section, the deployment transcript includes commands that are sent to the device, and any responses returned from the device. These responses can be informative messages or error messages. For failed deployments, look for messages that indicate errors with the commands. Examining these errors can be particularly helpful if you are using FlexConfig policies to configure customized features. These errors can help you correct the script in the FlexConfig object that is trying to configure the commands.
Note
There is no distinction that is made in the transcript between commands that are sent for managed features and those generated from FlexConfig policies.
For example, the following sequence shows that Cloud-Delivered
Firewall Management Center sent commands to configure GigabitEthernet0/0 with the logical name outside. The device responded that it automatically set the security level to 0. Firewall Threat
Defense does not use the security level for anything.
========= CLI APPLY =========

FMC >> interface GigabitEthernet0/0
FMC >>  nameif outside
FTDv 192.168.0.152 >> [info] : INFO: Security level for "outside" set to 0 by default.
Step 4
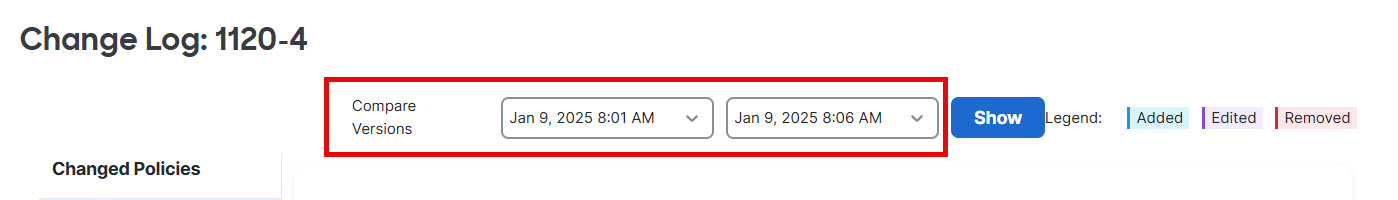
(Optional) Click Preview () to view the policy and object changes deployed on the device versus the previously deployed version.
Preview icon
To compare any two versions and view the change log, choose the required versions in the drop-down boxes and click the Show button. The drop-down boxes show the deployment job name and the end time of the deployment.
Compare versions
Note
The drop-down boxes also show failed deployments.
The Modified By column lists the users who have modified the policies or objects.
At the policy level, Cloud-Delivered
Firewall Management Center displays all the user names who have modified the policy.
At the rule level, Cloud-Delivered
Firewall Management Center displays the last user who has modified the rule.
You can also download a copy of the change log by clicking Download Report.
Note
Deployment history preview is not supported for certificate enrollments, HA operations, and failed deployments.
When a device is registered, preview is not supported for the job history record that is created.
Step 5
(Optional) Against each deployment job, click the More () icon and execute other actions:
Bookmark—To bookmark the deployment job.
Edit Deployment Notes—To edit your custom deployment notes that you added for a deployment job.
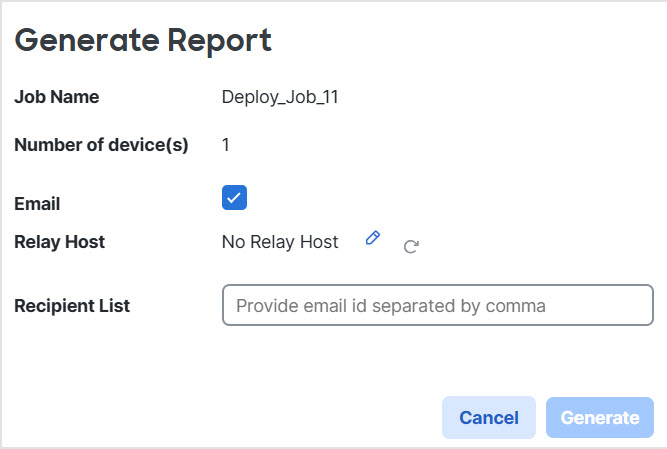
Generate Report—To generate a deployment report, which can be used for auditing. This report includes job properties with preview and transcript information, and the report can be downloaded as a PDF file.
Click Generate Report to generate a deployment report.
Generate report
In the Generate Report popup window, check the Email checkbox.
In the Recipient List, you can enter multiple email adddresses, separated by semicolons.
Click Generate to generate the report, and this report is emailed to the recipients.
In the Notifications task tab, you can track the progress. After the report generation is complete, click the link in the notification task tab to download the PDF report.